Most states add jobs year-over-year but not since May; most PPIs remain mild in June Editor’s note: Construction Citizen is proud to partner with AGC America to bring you AGC Chief Economist Ken Simonson's Data DIGest. Check back each week to get Ken's expert analysis of what's happening in our industry.
Seasonally adjusted construction employment increased in 38 states and the District of Columbia from June 2013 to June 2014 and decreased in 12 states, an AGC analysis of Bureau of Labor Statistics (BLS) data released Friday showed. The largest percentage gains were in Florida (11%, 41,700 jobs), Nevada (10%, 5,900) and Utah (9.3%, 6,800). Florida added the most jobs, followed by California (29,800, 4.7%) and Texas (19,100, 3.1%). The steepest 12-month percentage losses occurred in New Jersey (-8.1%, -11,200) and Alaska (-5.5%, -900). New Jersey lost the most construction jobs, followed by Arizona (-4,500, -3.6%). For the month, 21 states and D.C. added construction jobs, 27 states lost jobs and Arizona and New Mexico had no change. Florida added the most jobs between May and June (8,800, 2.2%), followed by Illinois (3,500, 1.8%). The largest percentage gains for the month were in South Dakota (4.3%, 900), Florida, Indiana (2.2%, 2,700) and Montana (2.2%, 500). The biggest one-month losses were in California (-9,500, -1.4%) and Texas (-3,400, -0.5%). Alaska had the steepest monthly decline (-7.7%, -1,300), followed by Oregon (-4.5%, -3,600). (BLS combines mining and logging with construction in D.C., South Dakota and five other states to avoid disclosing data for industries with few firms.)
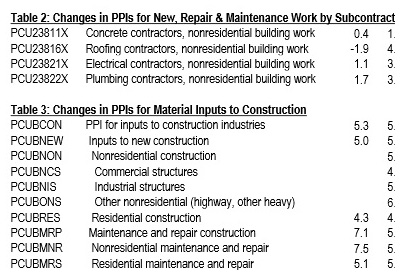
The producer price index (PPI) for final demand increased 0.3%, not seasonally adjusted (0.4%, seasonally adjusted), in June and 1.9% over 12 months, the Bureau of Labor Statistics reported last Wednesday. AGC posted an explanation and tables focusing on construction prices and costs. Final demand includes goods, services and five types of nonresidential buildings that BLS says make up 34% of total construction. There are no indexes yet for other building types, residential or nonbuilding construction. The PPI for final demand construction, not seasonally adjusted, rose 0.1% in June and 3.3% over 12 months. The overall PPI for new nonresidential building construction—a measure of the price contractors say they would charge to build a fixed set of five categories of buildings—rose 0.1% for the month and 3.4% since June 2013. Three building PPIs were flat in June: new warehouse construction (11% of the index for new nonresidential buildings), which rose 1.9% over 12 months; offices (34% of the total), up 3.1% over 12 months; and industrial buildings (13% of the total), up 3.5% over 12 months. The PPI for schools (26% of the total) rose 0.2% since May and 4.0% since June 2013; and health care buildings (16% of the total), 0.4% and 4.1%, respectively. PPIs for new, repair and maintenance work on nonresidential buildings by plumbing contractors rose 0.2% and 4.8%; roofers, -0.2% and 3.2%; electrical contractors, 0 and 1.7%; and concrete contractors, 0 and 1.2%. The PPI for inputs to construction—an average of the cost of all materials used in construction plus items consumed by contractors, such as diesel fuel—rose 0.1% in June and 1.9% over 12 months. Major construction materials with notable one- or 12-month price swings included lumber and plywood, -0.1% since May and 9.7% since June 2013; hot-rolled structural shapes, -0.3% and 9.4%; insulation materials, 0 and 9.3%; and gypsum products, 3.0% and 7.1%.
Informal soundings of businesses in the 12 Federal Reserve districts indicated expansion of economic activity between late May and July 7 was “moderate” in five and “modest” in seven, the Fed reported last Wednesday in the latest “Beige Book”. The districts are referenced by the name of their headquarters cities. “Production of construction inputs was mixed, as Kansas City and San Francisco reported a decrease in production and Philadelphia, Chicago and Dallas reported a slight increase….Residential construction activity generally increased across the districts, with only St. Louis and Minneapolis reporting a decline in overall activity….Commercial construction activity strengthened across most districts. Cleveland and Atlanta reported increased commercial construction activity compared to a year ago, and Philadelphia, Chicago, St. Louis, Minneapolis, Kansas City, Dallas and San Francisco noted gains since the previous survey period. Boston and Richmond saw mixed commercial construction activity across their districts since the previous report. Dallas indicated strong overall commercial real estate construction activity, and commercial real estate construction increased in the Minneapolis district compared with the previous report. Industrial real estate construction and leasing activity was strong in the Philadelphia and Chicago districts….skilled construction and craft workers were reportedly in short supply in the Cleveland, Richmond, Atlanta, Chicago, Kansas City and Dallas districts…. Dallas noted that the strongest wage pressures within its District were in the energy and construction sectors….Several districts noted higher prices for meat, dairy products, construction materials, fuel and some metals (namely steel, copper and nickel).”
Housing starts tumbled 9.3% at a seasonally adjusted annual rate in June from May but rose 7.5% compared with June 2013 levels, the Census Bureau reported last Thursday. Single-family starts fell 9.0% for the month and 4.3% year-over-year. Multifamily starts (buildings with 5 or more units) fell 11% and jumped 39%, respectively. Building permits, a fairly reliable indicator over time of future starts, dropped 4.2% in June and increased 2.7% year-over-year. Single-family permits rose 2.6% and 0.6%, respectively. Multifamily permits fell 17% from May and rose 6.7% from June 2013.
View June state employment data by state and rank. AGC of America has made the June PPI tables available for viewing online.
The Data DIGest is a weekly summary of economic news; items most relevant to construction are in italics. All rights reserved. Sign up at www.agc.org/datadigest.
AGC's Data DIGest: July 14-18, 2014
by Ken Simonson | July 21, 2014


Add new comment